Table of contents
Salary
Salary is an AlgoÉTS data project about pay in Canada. It turns recruitment-firm salary guides (PDF) and federal wage tables (CSV) into data frames, then compares jobs across provinces, regions and experience levels. It is useful to anyone who wants to see how a job such as cloud architect is paid from one region to another, and to readers interested in extracting tables from PDF reports.
1. Overview
The PDF path is handled by one script per guide edition. src/pdf_salary_scraper_2023_1.py and src/pdf_salary_scraper_2024_1.py read a guide in data/pdf/ with PyPDF2, track the current province and region from fixed name lists, split each line into a job title and three salary ranges (entry, mid and senior) and save the result as a pickle in data/pickle/. src/pdf.py is an earlier PyMuPDF experiment that tags text by font size to find headings.
src/wages_in_time.py loads the Job Bank wage files data/csv/wage_2012.csv to wage_2022.csv with Polars, harmonizes column names across years, caches the combined table in data/pickle/wages.pkl and prints the best-paid jobs per year and the best-paid engineering jobs per province. src/stackoverflow_scraper.py scrapes the salary table of the 2022 Stack Overflow survey.
Analysis happens in sandbox/salary_exploration_2023.ipynb and sandbox/salary_exploration_2024.ipynb, with helper versions of the same functions in src/analyse.py: split the ranges, compute means per level, rank jobs, filter engineering and Québec jobs, compare one job across regions and provinces, and find the jobs with the widest regional spread. api/app.py exposes the 2023 and 2024 pickles as JSON through FastAPI, and web/ holds two static HTML pages.
2. Use cases
Python scripts and notebooks that extract Canadian salary guides and wage tables to compare jobs by region.
- Extract salary guide PDFs
- Salary analyst
src/pdf_salary_scraper_2023_1.py and src/pdf_salary_scraper_2024_1.py read a guide in data/pdf with PyPDF2, track province and region, parse entry, mid and senior ranges per job and save a pickle in data/pickle.
- Load 2012–2022 wage tables
- Salary analyst
src/wages_in_time.py reads data/csv/wage_2012.csv to wage_2022.csv with Polars, harmonizes column names, caches data/pickle/wages.pkl and prints the top-paid jobs per year and engineering jobs per province.
- Compare jobs by region
- Salary analyst
sandbox/salary_exploration_2023.ipynb and salary_exploration_2024.ipynb rank jobs by maximum salary, filter engineering and Québec jobs, compare one job across regions and provinces, and find the widest gaps.
- Scrape Stack Overflow pay
- Salary analystStack Overflow survey
src/stackoverflow_scraper.py fetches the 2022 Stack Overflow survey salary page with httpx, parses the table with BeautifulSoup and pickles it to data/pickle/stackoverflow_salary_data.pkl.
- Query salary data over HTTP
- API client
api/app.py is a FastAPI app whose /load_pickle/2023 and /salary/2024 routes return the pickled guides as JSON; interactive documentation is at /docs.
2.1. Scenario: Compare cloud architect pay across Québec regions
- Run pip install -r requirements.txt from the repository root.
- Place 2023_salary_guide.pdf in data/pdf and run python src/pdf_salary_scraper_2023_1.py.
- Check that data/pickle/salary_guide_2023.pkl was written.
- Start jupyter notebook and open sandbox/salary_exploration_2023.ipynb, which splits each range and computes entry, mid and senior means.
- Call compare_job_province('cloud architect', 'québec') to rank Québec regions by mean mid-level salary.
Files readREADME.mdrequirements.txtsetup.pyvercel.jsonapi/app.pyapi/Dockerfileapi/docker-compose.ymlapi/setup.mdsrc/pdf.pysrc/pdf_salary_scraper_2023_1.pysrc/pdf_salary_scraper_2024_1.pysrc/stackoverflow_scraper.pysrc/wages_in_time.pysrc/analyse.pysrc/test.pydata/csv/README.mddata/pdf/README.mdsandbox/salary_exploration_2023.ipynbsandbox/salary_exploration_2024.ipynbweb/index.htmlweb/job_search.html
3. Results from the 2023 guide
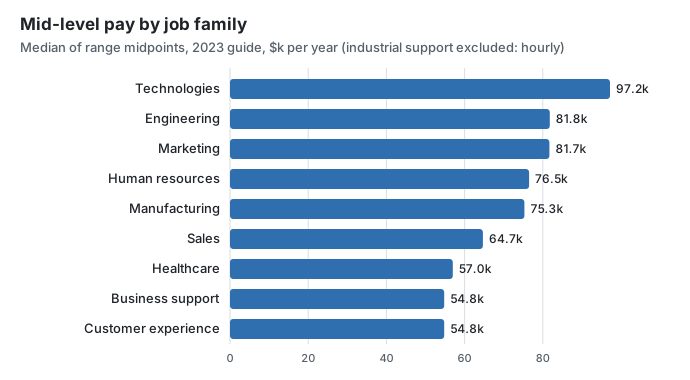
The repository keeps the raw text of the 2023 guide (the README names Randstad as the source) in sandbox/output/output.txt: one line per table cell, tagged with the heading level it came from. Re-reading that file with the table headers kept, instead of assuming every row is entry / mid / senior, gives the numbers below. All amounts are the guide’s own, in thousands of dollars per year, and each figure is the median of range midpoints (for “75.0 - 90.0”, the midpoint is 82.5). The companion article, What a Canadian salary guide says once the tables are read correctly, tells the same story with more context.
What is in the file.
| Count | Rows |
|---|---|
| Rows with salary ranges | 19,387 |
| In entry / mid / senior tables | 17,915 |
| In tables by years of experience (1, 3, 5, 10 years) | 760 |
| In tables by company revenue (10 M$, 100 M$, 1,000 M$) | 677 |
| Exact duplicates (same job, region and province) | 3,607 |
| Broken ranges (high above three times low, or below low) | 3 |
| Clean job-and-region rows left | 14,305 |
The 1,437 rows from the experience and revenue tables are finance and HR roles. The extraction scripts read them as entry, mid and senior, which is how a chief financial officer at a company with 1,000 M$ in revenue (594.1k at the top of the range) ends up as a “senior” salary in the notebooks. Of the clean rows, the 1,242 in the industrial support family are hourly rates ($19.8, $22.3 and $24.9 an hour at the three levels), so they are kept apart from the 13,063 annual rows, which cover 371 jobs in 57 regions.
Levels. The median midpoint is 66.2k at entry level, 75.9k at mid level and 86.8k at senior level. The step between levels is very regular: senior pay is 1.30 times entry pay for the median job, and 80% of rows fall between 1.22 and 1.36.
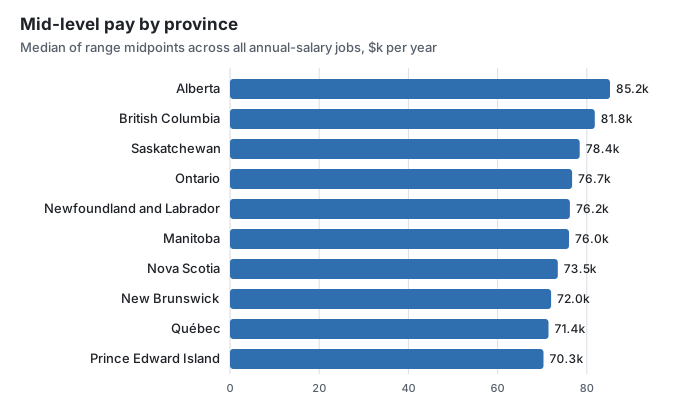
Provinces. Alberta has the highest median mid-level midpoint (85.2k), then British Columbia (81.8k) and Saskatchewan (78.4k); Québec (71.4k) and Prince Edward Island (70.3k) are lowest. These medians mix whatever jobs each region lists, and Québec alone has 16 regions, most of them outside Montréal, so the gap is partly a difference in which jobs and places are counted, not only in pay for the same job.
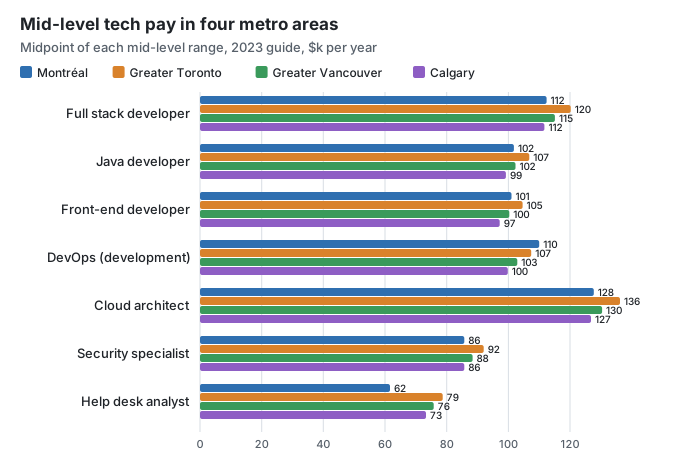
Same job, four cities. Comparing one job across regions removes the job-mix effect. For developer and architect roles the four metro areas are within about 10% of each other: a mid-level full stack developer is at 112.4k in Montréal, 120.2k in Greater Toronto, 115.1k in Greater Vancouver and 111.7k in Calgary, and DevOps (development) is highest in Montréal at 110.0k. The exception is support work: a mid-level help desk analyst is at 61.6k in Montréal against 78.7k in Greater Toronto.
Best-paid jobs. Among jobs listed in at least 25 regions, the highest median mid-level midpoints are director of operations (190.4k), e-commerce director (159.7k), construction director (153.6k), manufacturing director (153.3k) and procurement director (152.3k). The best-paid technology roles are IT director (151.8k), technical lead (143.1k) and application architect (132.2k).
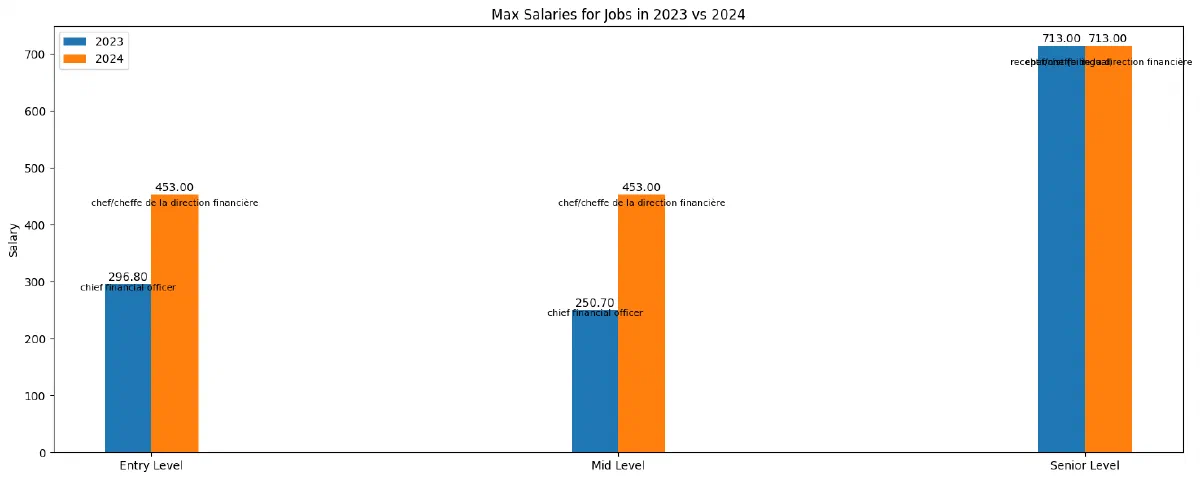
What the comparison notebook shows instead. sandbox/compare_2023_to_2024.ipynb compares the 2023 and 2024 pickles directly. Its maximum-salary chart puts “receptionist (bilingual)” at 713k, the broken Simcoe County row, and shows the same 713k for 2024 because the 2024 minimum and maximum lists read their senior value from df_sorted_2023. In the 2024 pickle, entry_max has exactly the same mean (94.67) and standard deviation as mid_max, which points to an entry range assembled from the wrong numbers. The 2024 guide is also in French (ingénieur·e chimiste) while 2023 is in English, so jobs cannot be matched across the two years by title.
4. Getting started
The README lists these steps:
pip install -r requirements.txt
python src/pdf.py
jupyter notebook
Run the extraction scripts from the repository root, since they use paths such as data/pdf/2023_salary_guide.pdf:
python src/pdf_salary_scraper_2023_1.py
python src/wages_in_time.py
api/setup.md describes Docker and Vercel deployment of the API; locally, it can be started with uvicorn from the api/ directory:
cd api
uvicorn app:app --reload
5. Repository guide
src/pdf_salary_scraper_2023_1.pyandsrc/pdf_salary_scraper_2024_1.pyextract the 2023 and 2024 guides (the README names Randstad as the source); the_2andgeneric_wipscripts are function-based variants.src/wages_in_time.pycombines the 2012–2022 Job Bank wage tables.src/stackoverflow_scraper.pyscrapes the Stack Overflow survey salary table.src/analyse.pyandsrc/utils.pyhold analysis and pickle helpers;src/__init__.pylists provinces and regions.sandbox/contains the 2023 and 2024 exploration notebooks and a 2023-to-2024 comparison.data/pdf/,data/csv/,data/pickle/anddata/geo/hold source guides from several recruitment firms, wage tables, extracted pickles and province shapefiles;data/csv/README.mddocuments the wage columns.api/contains the FastAPI app, Dockerfile, Compose file and deployment notes.web/index.htmlshows 2023 results as static text;web/job_search.htmlis a search form mock-up.
6. Features
- extract job, province, region and entry, mid and senior ranges from salary guide PDFs;
- combine eleven years of Job Bank wage tables into one Polars data frame;
- rank jobs by maximum salary, overall, per year, per province and for engineering roles;
- compare one job across regions and provinces and find the widest regional gaps;
- scrape Stack Overflow survey salaries;
- serve the extracted 2023 and 2024 guides as JSON through FastAPI.
7. Limits
- The README states the goal of a salary prediction model by region, experience and education; the repository contains extraction and exploration code, but no model.
- The README commands name
src/pdf_salary_scraper.pyand a rootstackoverflow_scraper.py, which do not exist under those names. requirements.txtmisses PyMuPDF, Polars and BeautifulSoup, which the scripts import;src/wages_in_time.pyuses an older Polars API.- Province and region come from the first name in a fixed list found anywhere on the page, the entry range joins the low of the first pair with the high of the second, and four-range lines are skipped. The README and
web/index.htmllist a bilingual receptionist at $713,000 as the top 2023 salary, which points to extraction errors. src/wages_in_time.pyannualizes hourly wages with 40 × 45 hours in one function and 45 × 45 in another, and flags the 2017 and 2018 files as badly formatted.- Deployment files disagree:
vercel.jsonbuilds a rootapp.pywhile the app isapi/app.py, the Dockerfile runsunicornon port 8000 while Compose maps 5000, and the API reads pickles through../datarelative paths. src/test.pyimports functions that do not exist, andsetup.pystill points to acodepackage directory and a template description.
8. Sources
- GitHub repository
- README
src/pdf_salary_scraper_2024_1.pysrc/wages_in_time.pysandbox/salary_exploration_2023.ipynbsandbox/compare_2023_to_2024.ipynbsandbox/output/output.txtapi/app.pydata/csv/README.md
9. CI/CD pipeline
No CI/CD pipeline in the repository. The code is built and run by hand, as described above.
Generated from the source at commit 40b10f4.
10. Deployment diagram
Mermaid Deployment diagram
flowchart LR
  repo[("GitHub repository")]
  image["Docker image<br/>FROM python:3.12.0rc3-slim"]
  host_Vercel("Vercel<br/>vercel.json")
  repo -->|"docker build"| image
  repo -.->|"configured"| host_Vercel
11. External dependencies
12 declared packages (12 runtime, 0 development) in requirements.txt, api/requirements.txt.
Package table 12
| Package | Version | Scope | Purpose | Registry |
|---|---|---|---|---|
python-dotenv | ==0.21.1 | runtime | Configuration | pypi.org |
backtesting | ==0.3.3 | runtime | Testing | pypi.org |
pandas | ==1.4.0 | runtime | Data analysis | pypi.org |
numpy | ==1.24.2 | runtime | Data analysis | pypi.org |
matplotlib | ==3.5.1 | runtime | Charts | pypi.org |
seaborn | ==0.11.2 | runtime | Charts | pypi.org |
PyPDF2 | ==3.0.1 | runtime | A pure-python PDF library capable of splitting, merging, cropping, and transforming PDF files | pypi.org |
dash | ==2.8.1 | runtime | User interface | pypi.org |
fastapi | — | runtime | Web framework | pypi.org |
uvicorn | — | runtime | Application server | pypi.org |
jinja2 | — | runtime | Templates | pypi.org |
pydantic | — | runtime | Data validation | pypi.org |
12. Glossary
Repository
The versioned source files, configuration, and history of a project.
README
The repository’s entry document, usually covering its purpose and initial setup.
Dependency
A library, tool, or service that another component needs to build or run.
API
An interface through which software components exchange requests and results. An API does not have to use HTTP.
HTTP
A request-and-response protocol used by browsers and web services. A method, path, headers, and optional body describe a request.
Container
An isolated process environment created from an image. Persistent data needs storage outside the container’s disposable filesystem.
Docker Compose
A configuration format and tool for starting related containers, networks, and volumes. Startup order alone does not guarantee service readiness.
Volume and bind mount
A volume is storage managed by the container platform; a bind mount exposes a chosen host path inside a container.
Published port
A host port mapped to a service’s container port. Publishing a port can expose that service beyond its container network.
CLI
A text interface in which commands and arguments select operations. Exit codes let scripts detect success or failure.
Build
The steps that turn source files and dependencies into a runnable program or distributable artifact.
Backend
An implementation behind a shared interface. Depending on context, it can mean a server-side service or a graphics, input, or storage implementation.
13. References
- AlgoETS. (2026, November 5). Salary. [Software repository] github.com.
- AlgoETS. (2026, November 5). README. [Source file or documentation] github.com.
- AlgoETS. (2026, November 5). src/pdf_salary_scraper_2024_1.py. [Source file or documentation] github.com.
- AlgoETS. (2026, November 5). src/wages_in_time.py. [Source file or documentation] github.com.
- AlgoETS. (2026, November 5). sandbox/salary_exploration_2023.ipynb. [Source file or documentation] github.com.
- AlgoETS. (2026, November 5). sandbox/compare_2023_to_2024.ipynb. [Source file or documentation] github.com.
- AlgoETS. (2026, November 5). sandbox/output/output.txt. [Source file or documentation] github.com.
- AlgoETS. (2026, November 5). api/app.py. [Source file or documentation] github.com.
- AlgoETS. (2026, November 5). data/csv/README.md. [Source file or documentation] github.com.
Sources without a publication date show the date they were last checked, November 5, 2026. File links retain the inspected revision where available.