Table of contents
The Salary project set out to answer a simple question: how is a given job paid from one Canadian region to another? It extracts recruitment-firm salary guides from PDF, puts them in data frames and compares them in notebooks. The notebooks already contain charts. Several of them are wrong, and the reasons are more instructive than the charts themselves.
This article re-reads the 2023 guide from the text the repository already extracted, fixes what went wrong, and reports what the guide actually says.
1. Where the numbers come from
The 2023 guide (the README names Randstad) lists, for each of 56 named regions, tables of jobs with three salary ranges. The repository’s extraction step left a full text dump in sandbox/output/output.txt, one cell per token, each tagged with the heading level it came from:
<h1>calgary metropolitan region | <h3>business support & operations | <h5>entry | mid | senior |
<p>administrative assistant | 43.6 - 56.4 | 49.9 - 61.3 | 55.2 - 66.7 | ...
That tagging is enough to rebuild the tables: <h1> is the region, <h3> the job family, <h5> the column headers, <p> a job followed by its ranges, and a <h2> footer at the bottom of each page names the province. Amounts are thousands of dollars per year. Every figure below is the median of range midpoints, so “75.0 - 90.0” counts as 82.5.
2. Three things the extraction got wrong
Not every table is entry / mid / senior. Of 19,387 rows with salary ranges, 17,915 sit under the usual three experience levels. The finance and HR sections are different: 760 rows have four columns for 1, 3, 5 and 10 years of experience, and 677 rows have three columns for company revenue, 10 M$, 100 M$ and 1,000 M$. The scraper assumed three experience levels everywhere. So a chief financial officer at a 1,000 M$ company, top of range 594.1k, became a “senior” salary, and the CFO row tops the notebook’s maximum-salary chart.
Duplicates and typos. 3,607 rows repeat a job, region and province already seen; the analysis keeps the first occurrence. Three rows have impossible ranges. The most visible one is a bilingual receptionist in Simcoe County whose senior range reads “63.1 - 713.0”, probably 71.3 in the original. In the notebooks, that row is the highest salary in Canada.
Mixed units. The industrial support family (pickers, labourers, drivers, janitors) is quoted per hour: 97% of its mid-level midpoints are under 30. Mixed with annual salaries in thousands, they drag every average down and make “regional spread” rankings meaningless.
The comparison notebook adds two code bugs. The 2024 minimum and maximum lists take their senior value from the 2023 frame (df_sorted_2023), so the 713k outlier appears in both years. And in the 2024 data, the entry-level maximum has exactly the same mean (94.67) and standard deviation as the mid-level maximum, which points to an entry range built from the wrong numbers. The 2024 guide is also in French while 2023 is in English, so the two years cannot be joined by job title at all.
After dropping the three broken rows and the duplicates, 14,305 job-and-region rows remain: 13,063 annual rows covering 371 jobs in 57 regions (York Region exists in both Ontario and New Brunswick), and 1,242 hourly rows.
3. What the guide says
Levels move in fixed steps. The median midpoint is 66.2k at entry level, 75.9k at mid level and 86.8k at senior level. For the median job, senior pay is 1.30 times entry pay, and 80% of all rows fall between 1.22 and 1.36. That regularity is worth knowing before reading anything into a single job’s progression. Hourly industrial support work moves the same way, from $19.8 to $22.3 to $24.9 an hour.
Technology pays the most, by a clear margin.
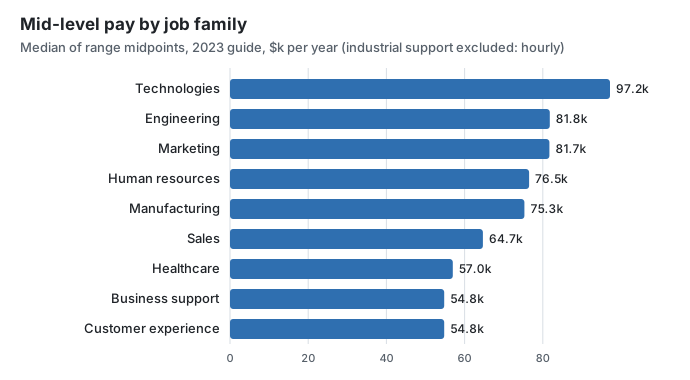
Technology roles have a median mid-level midpoint of 97.2k, about 15k above engineering (81.8k) and marketing (81.7k). Customer experience and business support are lowest, both at 54.8k.
Province rankings mostly reflect which jobs are listed.
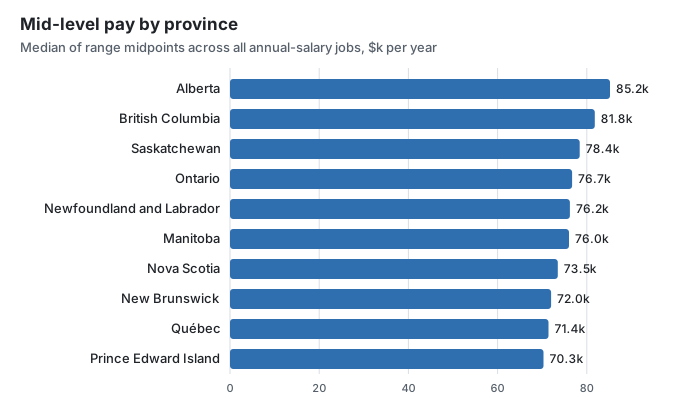
Alberta comes first at 85.2k and Prince Edward Island last at 70.3k, with Québec at 71.4k. But each region lists its own set of jobs, and Québec alone has 16 regions, most of them outside Montréal. A province median compares baskets, not salaries.
For the same job, big cities are close.
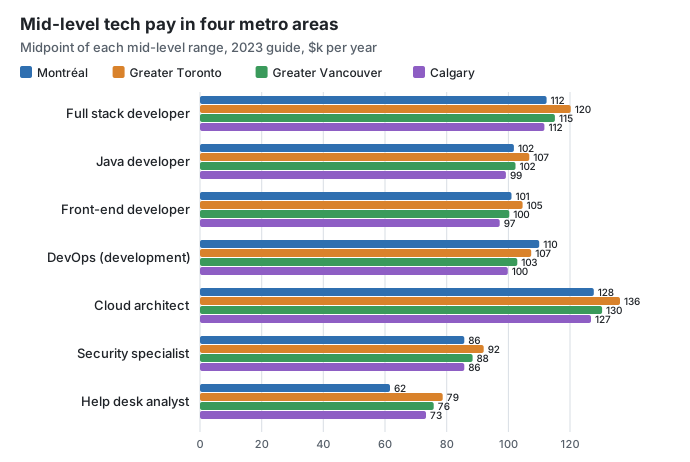
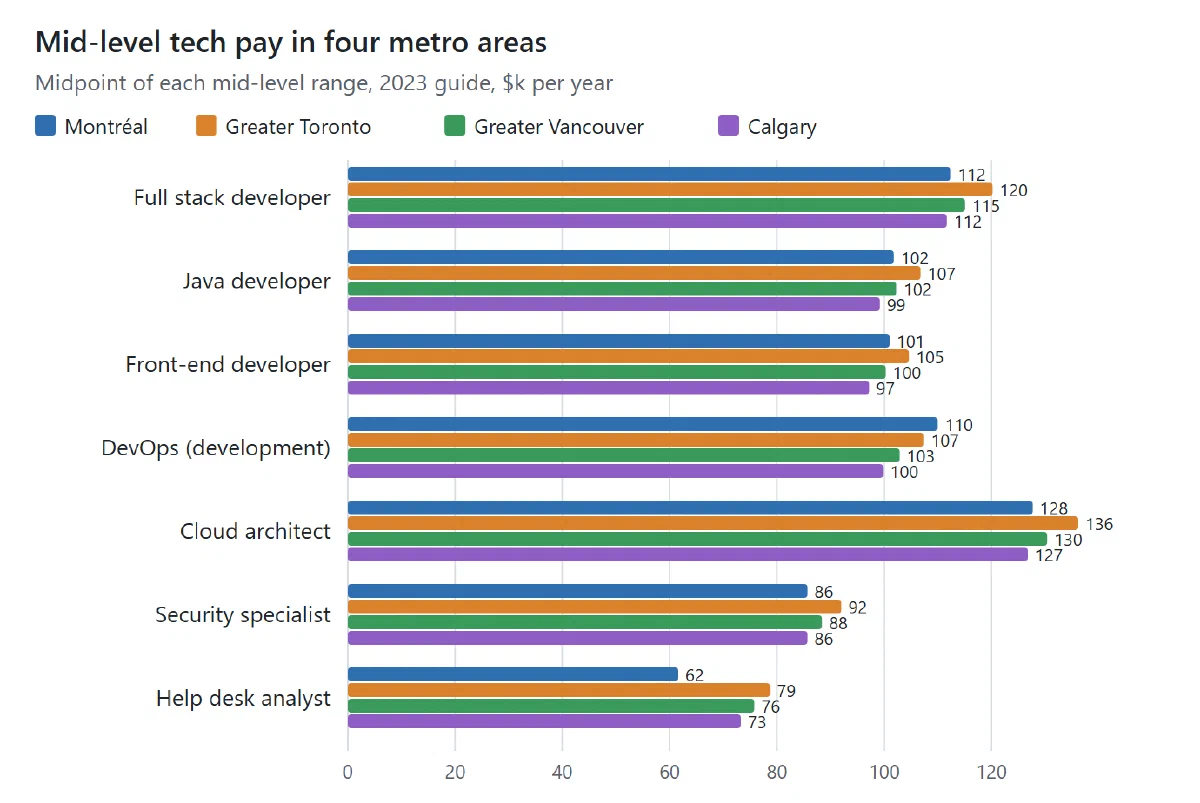
Holding the job fixed removes the basket problem. For developer and architect roles, Montréal, Greater Toronto, Greater Vancouver and Calgary are within about 10% of each other. A mid-level full stack developer is at 112.4k in Montréal and 120.2k in Greater Toronto; a cloud architect at 127.7k and 136.2k. DevOps (development) is highest in Montréal, at 110.0k. Support roles are where the cities part ways: a mid-level help desk analyst is at 61.6k in Montréal against 78.7k in Greater Toronto, a 22% gap.
Directors lead everywhere. Among jobs listed in at least 25 regions, the best-paid median midpoints are director of operations (190.4k), e-commerce director (159.7k), construction director (153.6k), manufacturing director (153.3k) and procurement director (152.3k). On the technology side, IT director (151.8k), technical lead (143.1k) and application architect (132.2k) lead.
4. Limits of this reading
- These are a recruitment firm’s ranges, not observed pay. They say what the firm quotes, not what people earn.
- Medians of midpoints ignore how wide each range is.
- Province footers are taken as printed; one region, Fort St. John, sits on pages with an Alberta footer.
- One Québec-only job, “head of workshop and assembly”, has a median midpoint of 249k across its 11 regions and is probably mis-extracted; the “at least 25 regions” ranking leaves it out.
- The 2024 guide is not used here: its entry ranges are unreliable in the saved data and its titles are in French.
5. What to fix in the repository
The fixes are small. Keep the <h5> header with each row and only map it to entry / mid / senior when the header says so. Drop exact duplicates on job, region and province. Flag ranges whose high is below the low or more than three times it. Store a unit per job family. Then the comparison notebook’s charts become meaningful, and a 2023-to-2024 comparison needs a title mapping between the English and French guides.
The project note has the code walkthrough, the setup and the full list of limits: Salary: exploring Canadian salary guides and wage data.