Trading is about ranges, not one magic price. I used forward Monte Carlo on Apple daily closes: estimate log-return drift and volatility before 2023, simulate many paths, then check whether 2023 hold-out prices fell inside a 5th–95th percentile band. Version française.
Forward Monte Carlo vs MCMC
| Tool | Question it answers |
|---|---|
| Forward Monte Carlo (this post) | “How wide could prices swing under a simple GBM-style model?” |
| MCMC (e.g. Landauskas & Valakevičius KDE sampling) | “What distribution fits observed prices before simulating?” |
You can combine them: fit with MCMC, explore scenarios with forward paths. This article implements the forward step in Python; AlgoETS/MarkokChainMonteCarlo explores MCMC-oriented experiments.
Setup
Libraries: pandas, numpy, httpx, matplotlib, scipy, rich, optional backtesting / pandas_ta for related charts. Historical prices via Financial Modeling Prep API helpers in the original notebook.
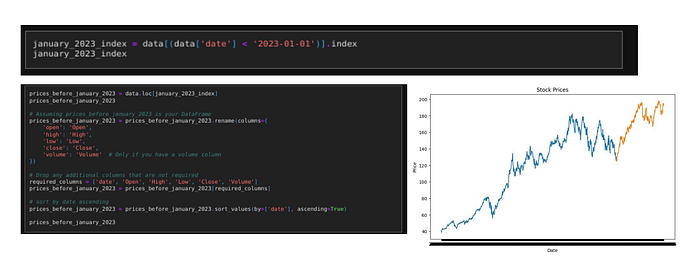
Train / hold-out split
Pull full history for AAPL, split at 2023-01-01:
- Train — estimate mean/variance of log returns.
- Hold-out — compare simulated bands to realized closes.
The simulation core
Estimate log returns on train window → daily drift and volatility → draw Gaussian shocks → propagate price with exp(drift + vol * Z).
def monte_carlo_simulation(data, days, iterations):
    log_returns = np.log(data[1:] / data[:-1])
    mean, variance = log_returns.mean(), log_returns.var()
    drift = mean - 0.5 * variance
    daily_vol = log_returns.std()
    # ... iterate days × iterations, return price paths
Full implementation and plotting loops: Medium original.
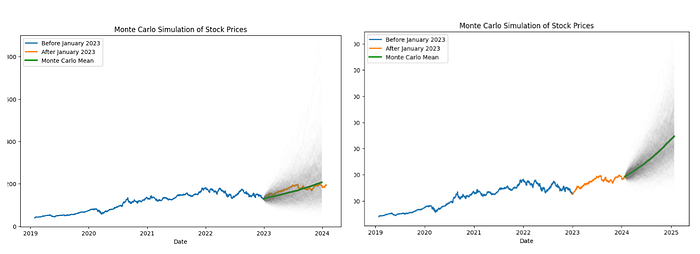
Reading the output
- Fan of gray paths — scenario diversity.
- Median and mean paths — central tendency (not identical under skew).
- 5th–95th band — risk-style interval for “where might price land.”
- Hold-out dot — did reality sit inside the band at the aligned horizon?
Terminal distribution gives quantile prices and simple return percentiles vs last train close — useful for “how wrong is the model?” not “buy signal.”
When not to use GBM Monte Carlo alone
| Limitation | Reality |
|---|---|
| Constant vol | Markets cluster volatility |
| No jumps | Earnings gaps exist |
| Single name | Diversification ignored |
| Not a strategy test | Pair with backtesting posts |
Takeaway
Monte Carlo answers model risk width on a hold-out window; backtesting answers rule PnL. Keep the questions separate.
Related posts
Reference
- Landauskas, M. & Valakevičius, E. (2011). Modelling of Stock Prices by MCMC
- Investopedia — Monte Carlo basics
Originally published on Medium. Notebook code: see repo and Medium for full listings.