I collect LEGO and write Python — so I merged Rebrickable exports with a BrickEconomy scraper to see how sets, colors, and themes evolved, and whether a simple model could explain prices on classics like 001-1. This page is the story with charts; full notebooks live in AlgoETS/LegosTracker. Version française.
Data sources
| Dataset | What it gives you |
|---|---|
| Rebrickable CSVs | sets, themes, parts, colors, inventories — great for counts and joins |
| BrickEconomy (scraped) | historical resale-style prices Rebrickable does not ship |
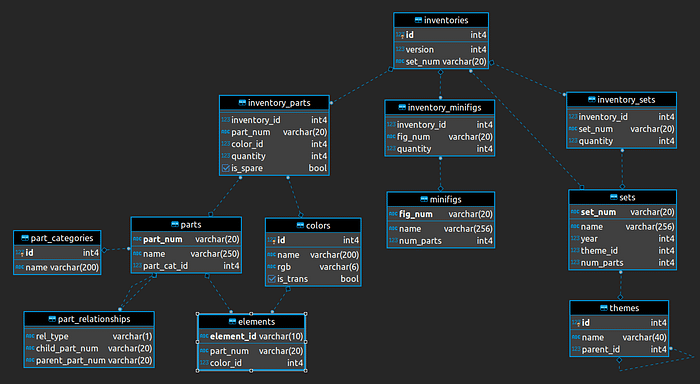
Rebrickable files include sets.csv, themes.csv, parts.csv, colors.csv, and inventory tables — standard star schema for “how big is LEGO over time?”
Sets over the decades
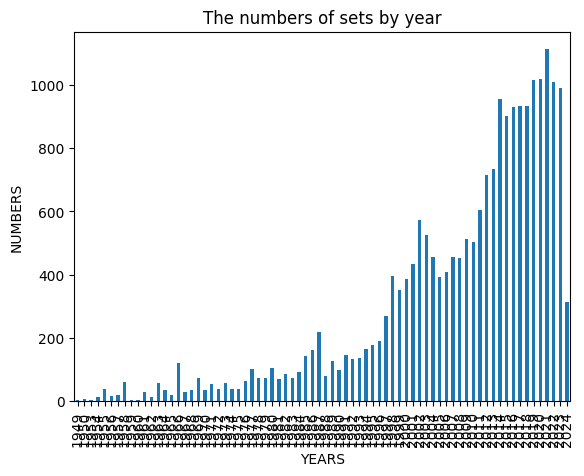
Two trends jump out when you group by year:
- Count of named sets rises — LEGO product line expansion is real in the data.
- Average part count per set climbs — models got denser, not just more numerous.
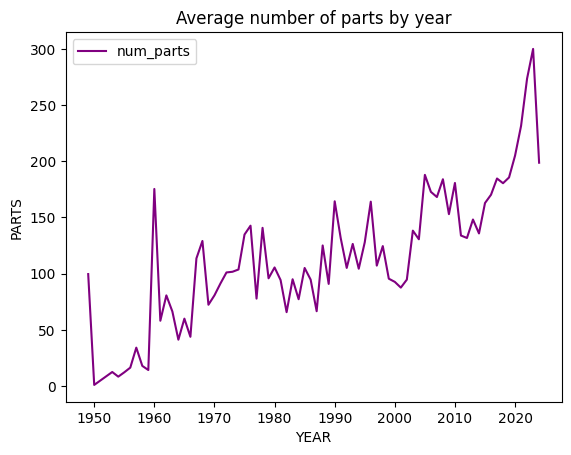
Narrative check: adult-targeted lines and licensed themes show up as tail mass in part counts, not only kid-scale sets.
Themes — what dominates the catalog
Join sets.theme_id → themes, filter to top-level themes (no parent_id), bar-chart the top ten by set count.
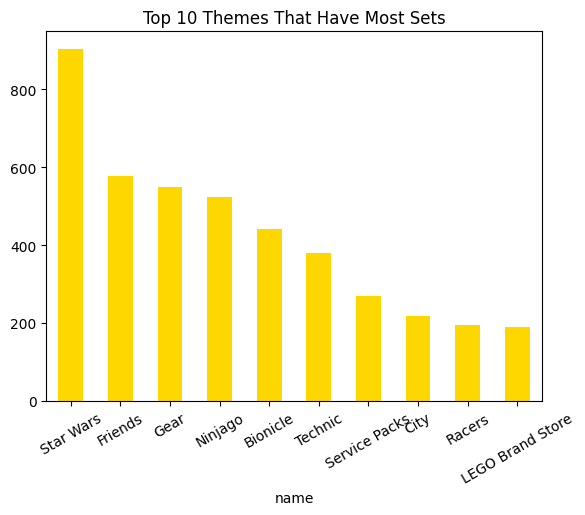
Star Wars, City, Technic, and friends crowd the head — good sanity check that merges worked before you trust price scrapes.
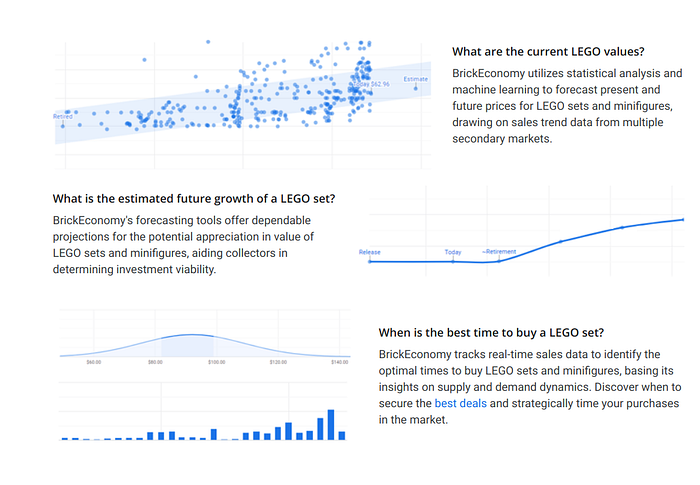
Why scrape BrickEconomy?
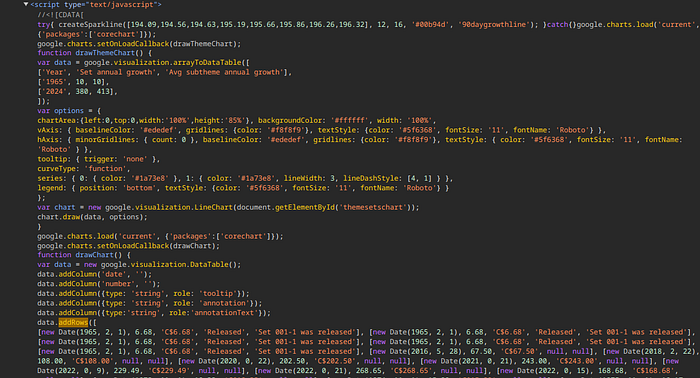
Rebrickable answers what exists; it does not answer what people pay on the secondary market. I used Playwright + asyncio to collect BrickEconomy pages — pydantic models for validation, aiohttp where fetch-only sufficed.
Scraper code, rate limits, and HTML drift handling: see LegosTracker repo — too long to paste here and keep maintainable.
Environment (reference)
pip install playwright asyncio pydantic aiohttp pandas scikit-learn matplotlib
playwright install
Imports and async browser setup match the repo’s scraper/ module — run from project root with tests on a single set before batching thousands.
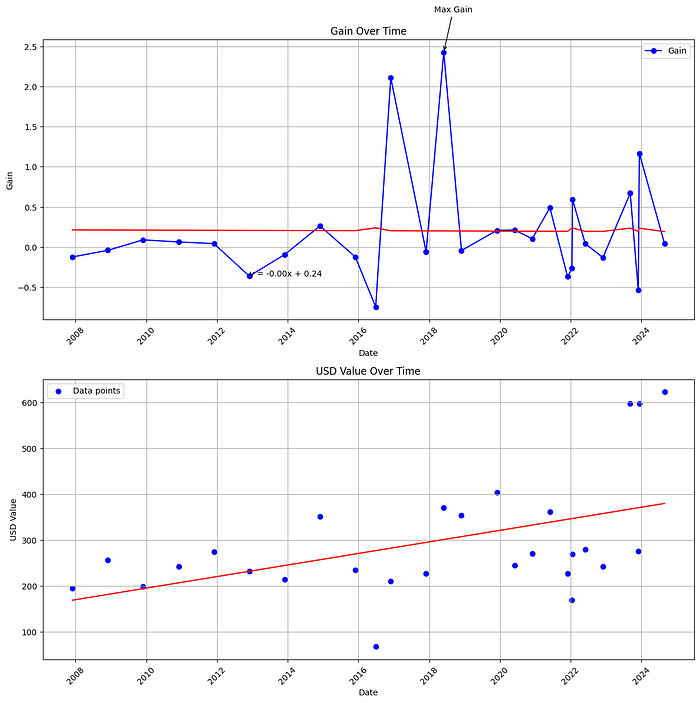
Price history for set 001-1
Classic 001-1 is a teaching anchor: long history, recognizable name, enough secondary-market churn to plot.
Pipeline:
- Load scraped
001-1_history.csv/001-1_new.csvfrom LegosTracker data folder. - Clean dates and outliers (bad rows from HTML changes).
- Plot price vs time — look for step changes around reissues and collector spikes.
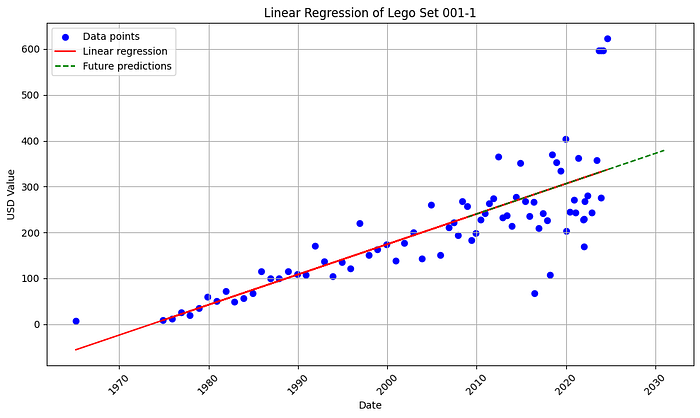
Linear regression — humble forecast
Fit a simple linear model on engineered features (time, condition flags, maybe part count proxies) to predict logged price.
It is not alpha — it is explainability practice:
- Does trend dominate?
- Do residuals cluster by era?
- Would a tree model buy you much on N=small?
Full coefficient tables and train/test split notes: Medium original article and repo notebooks.
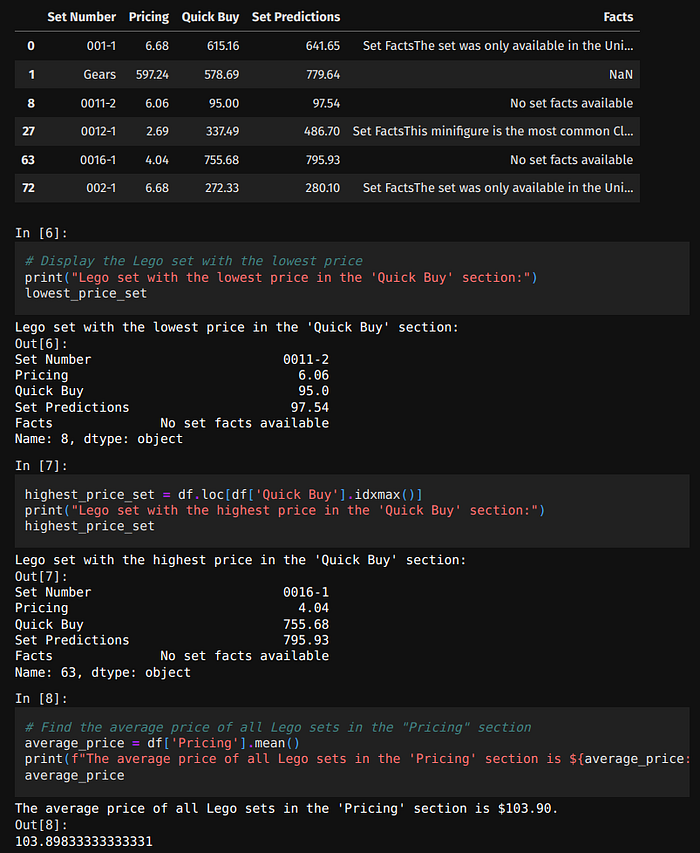
Notebook excerpts
The Medium import contained pages of one-line pandas plots. Prefer the GitHub project for copy-pasteable cells:
- Theme merges and bar charts
- Scraper orchestration
- Price cleaning
sklearnregression pipeline
When not to trust this analysis
| Pitfall | Effect |
|---|---|
| Scraper breakage | Missing months look like price crashes |
| Survivorship in sets table | Discontinued sets skew counts |
| Linear model on hype sets | Residuals explode |
| Treating resale as MSRP | Different economic story |
Takeaway
LEGO data is messy fun — good for pandas practice, async scraping discipline, and remembering that secondary prices are sentiment plus plastic, not fundamentals.
Related posts
- Economics of LEGO (FR) — same analysis in French
- Vector databases / movie embeddings — another teaching dataset story
- MarketWatch Python — different market, same curiosity
References
Originally published on Medium.